
By 2025, healthcare finance teams will face unprecedented billing challenges, including strict regulatory changes, AI-driven workflows, complex interoperability, and growing cyber threats. Experts predict that providers will increasingly leverage in-house automation and targeted outsourcing rather than broad vendor contracts. In this context, traditional metrics (denial rates, collection rates, etc.) are insufficient.
The following seven KPIs incorporate cutting-edge technical factors (automation depth, regulatory agility, AI accuracy, routing precision, interoperability reliability, security resilience, and credentialing efficiency) to give CFOs and RCM leaders a nuanced ROI and performance comparison between in-house and outsourced billing services.
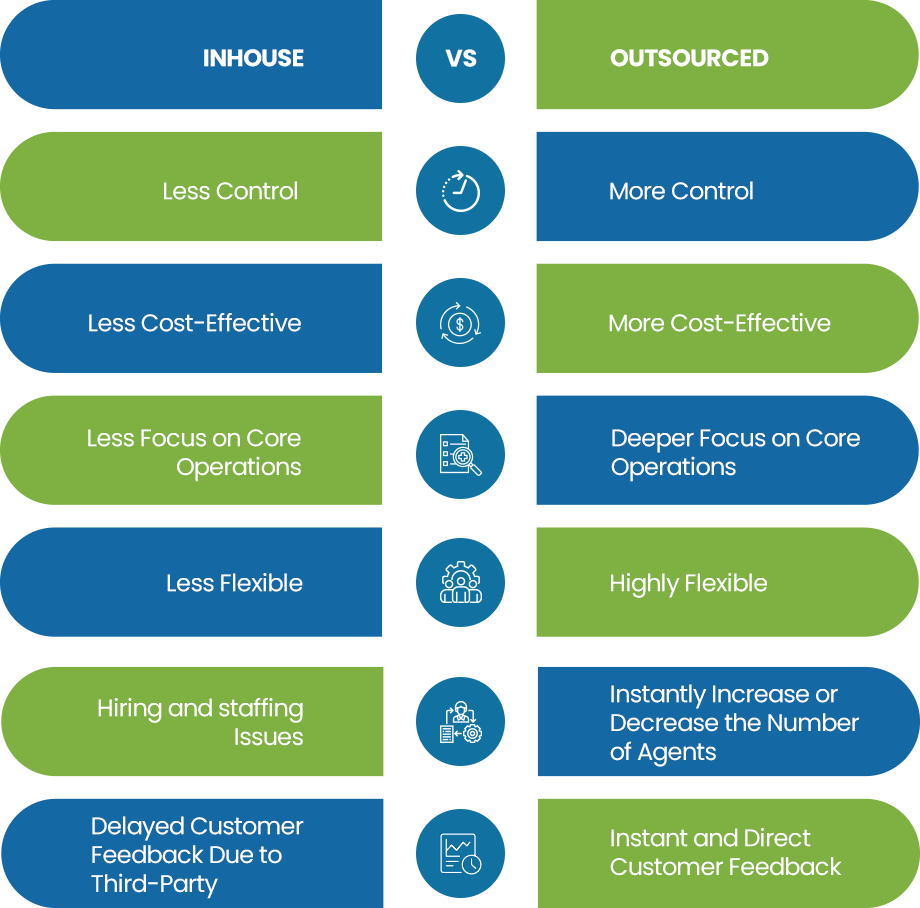
In-House or Outsourced Billing? Let These 7 KPIs Guide You
Automated Claims Pre-Validation Rate
The percentage of claims processed through advanced automated scrubbing (rule engines, RPA, AI) without manual intervention. In practice, this is calculated as (number of claims auto-validated by the system) ÷ (total claims submitted) × 100%.
Relevance: A high pre-validation rate indicates deep automation integration in the billing workflow, reducing manual edits, transcription errors, and rework. Automation can significantly improve first-pass acceptance: one industry study found that advanced claim-automation tools boost first-pass claim acceptance rates by ~25% compared to manual processes. This KPI highlights how effectively AI/rules engines are catching coding mistakes, missing data, and authorization requirements before submission, which lowers administrative costs and speeds reimbursement.
Data Collection: Use system logs from the billing platform or claims engine. Capture how many claims pass all automated checks (completeness, coding consistency, payer rules) versus those flagged for human review. Modern billing systems tag each claim with “auto-scrubbed” or “manual-review” status. The metric is updated continuously or in daily/weekly batches.
Strategic Use: A declining pre-validation rate signals that automation needs enhancement – for example, updating scrubbing rules or AI models. Outsource medical billing services often invest heavily in proprietary AI scrubbing, so an outsourcer’s pre-validation rate can be benchmarked against in-house performance. If an in-house team consistently falls short, an organization may consider outsourcing or a hybrid approach. Conversely, very high automation rates can justify adding specialized in-house AI tools, since manual error sources are minimized. This KPI thus guides investment in AI/RPA: one can compare cost-per-claim manually versus with automation to calculate ROI on these technologies.
Regulatory Adaptation Cycle Time
The elapsed time between the publication of a new regulatory/payer rule (e.g. ICD revisions, Medicare fee schedule updates, insurer policy changes) and the update of that rule in the billing system. Usually measured in business days or hours.
Relevance: This metric quantifies regulatory agility. Shorter cycle times mean the organization implements compliance changes faster, reducing the risk of coding non-compliance, denied claims or fines. With “heightened scrutiny over accurate billing practices and provider credentialing” in 2025, delays in updates directly translate to revenue leakage. For example, if a new ICD-10 code is required effective Jan 1, a billing system that updates it within days avoids erroneous charges that would be rejected later.
Data Collection: Track two dates for each rule or code change: its official effective date (or regulatory release date) and the deployment date in your billing platform (or EHR-integrated coding engine). Calculate the difference as the implementation latency. Maintain a log of regulatory bulletins (CMS, state, major payers) and cross-reference with system update release notes.
Strategic Use: A long or growing cycle time is a red flag on compliance risk. Compare in-house vs. outsource medical billing services: a vendor with dedicated compliance teams may consistently update rules within days, whereas an internal team might lag. An organization can set internal benchmarks (e.g. <30 days) and hold teams or vendors to SLAs. By breaking down this KPI by regulation type or payer, leaders can allocate resources (e.g. additional compliance staff, real-time update APIs) where gaps occur. Continuous monitoring of this KPI turns compliance from a black-box risk into a trackable operational metric.
AI Coding Suggestion Accuracy
The accuracy of AI-assisted coding, defined as the percentage of AI-generated code suggestions (ICD/CPT) that match the final approved codes. Mathematically, it can be framed as Accuracy = (True Positives + True Negatives) ÷ (All Suggestions) when comparing AI vs. human-coded outcomes.
Relevance: As AI-based coding tools are adopted, this metric measures their effectiveness and trustworthiness. High accuracy means the AI is reliably replicating expert coder decisions, which streamlines workflow and frees staff to focus on complex cases. It also indicates how well the AI model is tuned to the organization’s documentation standards and specialty mix. Since payers are increasingly using AI to comb through claims, having a strong AI-coder synergy is critical to matching their pace.
Data Collection: Use audit logs from AI-assisted coding modules. Each time an AI engine suggests one or more codes, record whether the coder accepts, modifies or rejects each suggestion. Over a defined period (e.g. monthly), compute the percentage of suggestions accepted as-is. Also track discrepancies (e.g. extra or missing codes) and their financial impact.
Strategic Use: This KPI helps evaluate ROI of AI coding tools. If accuracy is low, invest in model retraining or combine AI suggestions with targeted human checks. Compare in-house vs. outsource medical billing services: some billing vendors bundle their own AI coding engines, whereas an in-house team might use commercial AI products. By benchmarking this score, organizations can determine if outsourcing (with high-accuracy AI tools) or enhanced internal AI integration yields better revenue capture and coder productivity. It also feeds into quality assurance: consistent high accuracy supports scaling back manual reviews (cost savings), while drops in accuracy prompt audits to prevent compliance issues.
Claim Routing Accuracy Rate
The percentage of claims submitted to the correct payer or payer-plan on the first attempt. Equivalently, it’s (Number of correctly routed claims) ÷ (Total claims submitted) × 100%. Incorrect routing includes mis-targeted insurer IDs, wrong payor channels, or use of obsolete payer rules.
Relevance: Accurate claim routing ensures that claims reach the intended payer system immediately, avoiding delays, rejections, or manual rework. Poor routing can send claims bouncing between clearinghouses or generating so-called “pended” claims, which extends days-in-A/R and increases costs. A high routing accuracy indicates effective payer-directory management and system configuration, which is especially challenging in multi-payer environments with evolving plan networks.
Data Collection: Analyze clearinghouse/EDI logs and payer acknowledgements. Count how many claims initially fail or are rejected due to “payer mismatch” errors or non-enrollment (vs. those accepted on first pass). Billing platforms often tag the specific error codes for misrouting. Calculate this KPI daily or weekly in outsource medical billing services.
Strategic Use: A drop in routing accuracy may indicate outdated payer tables or integration issues in the billing system. In-house teams must update payer information; an outsourced RCM partner should include this in their service. Comparing models, in-house billing may lag if IT resources are constrained, whereas a specialized outsource medical billing services might maintain extensive payer databases. Leaders can set targets (e.g. >99% routing accuracy) and use this KPI to decide whether additional clearinghouse tools or vendor management is needed. Efficient routing directly reduces avoidable denials and labor, so it factors into ROI: a vendor that minimizes rerouting could justify its fees vs. in-house maintenance costs.
Eliminate payer mismatches while outsourcing your medical billing services to experts. Who got it right the first time!
Interoperability Transaction Success Rate
The percentage of automated interoperability transactions (eligibility checks, prior authorizations, eRemits, claim status inquiries, etc.) that complete successfully without errors or fallbacks to manual processes. Formally, (Number of successful API/EDI transactions) ÷ (Total attempts) × 100%.
Relevance: Interoperability is crucial for modern RCM. Errors in data exchange (timeouts, EDI format mismatches, failed FHIR requests, etc.) force staff to engage in time-consuming workarounds. A high success rate signals that billing platforms, payer interfaces, and EHRs are well-integrated. As one industry analyst notes, “interoperability is becoming a critical component of effective RCM” and seamless data exchange is essential for efficiency. This KPI captures the reliability and throughput of those connections.
Data Collection: Use interface logs and API monitoring tools. For each interoperability transaction (e.g. a 270/271 eligibility check or a FHIR API call for authorization status), record success vs. failure codes. Calculate the ratio over a rolling period. Break down by transaction type (eligibility, remittance, etc.) if needed. Modern RCM services dashboards used by outsource medical billing services can automate this tracking.
Strategic Use: Low success rates point to technical integration gaps – for instance, outdated payer endpoints or schema mismatches. Outsource billing medical companies often maintain dedicated integration teams; if their success rate is significantly higher than in-house, it indicates superior connectivity. This metric also ties to payer-provider interoperability compliance: a high error rate could trigger audits or regulatory issues. By monitoring and improving this KPI, leaders can decide whether to invest in middleware/APIs or leverage a vendor’s more robust interfaces. In value-based contexts (where real-time data sharing is needed), this KPI gains further strategic weight.
Critical Vulnerability Patch Compliance Rate
The proportion of identified critical (and high-severity) security vulnerabilities in billing and RCM systems that have been patched within the organization’s target timeframe. Typically tracked as (Number of critical vulnerabilities patched on time) ÷ (Total critical vulnerabilities detected) × 100%.
Relevance: Billing systems contain sensitive patient and financial data, making them prime targets for cyberattacks. Unpatched vulnerabilities can be exploited, leading to breaches that result in regulatory penalties and massive revenue loss. In 2023 the healthcare sector saw 725 breaches exposing over 133 million records. Therefore, this KPI assesses how well an organization manages cybersecurity risk in the revenue cycle. A high patch compliance rate (industry benchmarks aim for ~95–99%) means known security holes are closed quickly.
Data Collection: Collaborate with IT security teams. Use vulnerability scanning tools and patch management logs. For each critical finding on servers and network devices that support billing (e.g. claim servers, clearinghouse appliances, database servers), record the timestamp of the finding and the patch deployment date. The patch compliance rate is usually calculated monthly. Also track Mean Time to Detect/Respond (MTTD/MTTR) for incidents as supporting metrics by outsource medical billing services.
Strategic Use: Falling behind on critical patches should trigger resource realignment – possibly engaging external managed security services. Compare in-house IT vs. an outsource medical billing services or co-managed arrangement: specialized security vendors may achieve faster remediation times. By linking this KPI to ROI, CFOs can quantify the trade-off between cybersecurity investments and avoid breach costs. For example, a breach’s average incident cost can be hundreds of dollars per record; maintaining high patch compliance directly protects that value. This metric also demonstrates compliance with frameworks (NIST, HIPAA): a patch rate of 95%+ on all systems is a common security goal and a core component of a successful NIST assessment In summary, Critical Patch Compliance Rate helps align IT security efforts with financial risk management.
Provider Credentialing Turnaround Time
The average number of days required to complete provider enrollment and credentialing with payers (from initial application to “active status” in payer systems).
Relevance: Untimely credentialing blocks reimbursement. Each day a new provider or service line is uncredentialed represents lost revenue. Maintaining up-to-date credentials is also a regulatory and payer requirement. Recent analysis warns that “providers will face heightened scrutiny over … provider credentialing” and that proper enrollment is pivotal to minimizing claim rejections. This KPI quantifies the speed and efficiency of managing those compliance processes.
Data Collection: Record the date each credentialing request is submitted to a payer and the date the payer grants enrollment. Track this for all providers (physicians, mid-levels, new hires) and payers. The result can be reported as an average (or median) turnaround time, and also as a percentage of credentialing tasks completed within target (e.g. within 60 days). Most outsource medical billing services or RCM systems have a credentialing module or fields to capture these dates.
Strategic Use: If in-house credentialing is slow, claims for certain providers may be routinely denied for “provider not enrolled,” dragging down collections. Many outsourcing partners offer specialist credentialing services to handle this – using this KPI helps decide whether to outsource that function. For example, if an RCM vendor maintains 30-day average credentialing vs. 90 days in-house, the faster turnaround can significantly improve cash flow. CFOs can set goals (e.g. 80% of credentials active within X days) and hold teams/vendors accountable. In summary, Credentialing Turnaround Time reveals administrative efficiency and directly impacts ROI by preventing avoidable write-offs.
Final Thoughts
Each of these KPIs should be monitored continuously and trended over time. By comparing the performance of in-house teams versus outsource medical billing services on these metrics, healthcare leaders gain a technical view into which model yields better efficiency, compliance and financial returns. Collectively, they ensure strategic decisions are driven by data on automation leverage, regulatory readiness, AI effectiveness, data integration, and security – all critical dimensions of modern medical billing operations.